Dealer Bust Odds by Up-Card
Every decision in basic strategy depends partly on one question: how likely is the dealer to bust? Here are our modeled figures for every up-card—the same probability method our free trainer uses live.
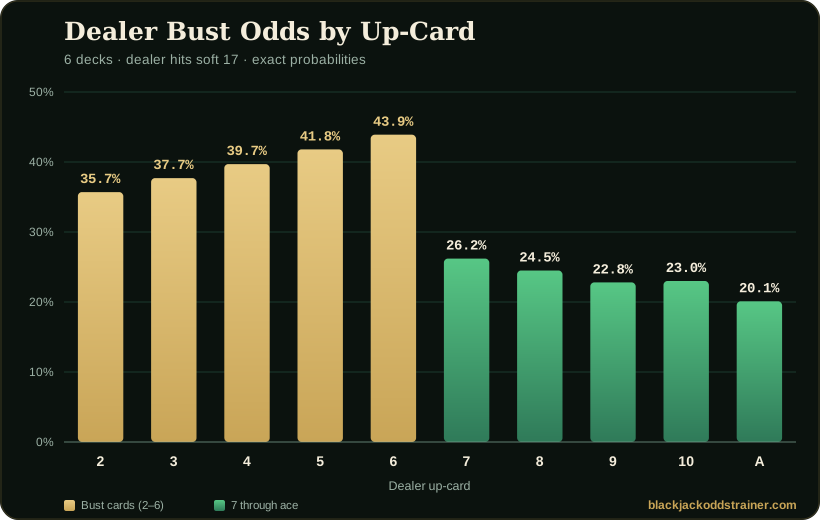
A dealer showing a 6 busts 43.9% of the time — the weakest card in the deck. An ace busts just 20.1%. Cards 4, 5, and 6 are the "bust cards" you stand and double against; 7 through ace make a hand 3 times out of 4.
Compare H17 and S17 dealer bust odds
H17 makes the dealer draw on soft 17; S17 makes the dealer stand. These modeled rates use the same six-deck starting assumptions as the tables below. Differences are in percentage points, not relative percent changes.
| Upcard | S17 | H17 | H17 minus S17 |
|---|---|---|---|
| 2 | 35.4% | 35.7% | +0.3 pp |
| 3 | 37.4% | 37.7% | +0.3 pp |
| 4 | 39.4% | 39.7% | +0.3 pp |
| 5 | 41.6% | 41.8% | +0.2 pp |
| 6 | 42.3% | 43.9% | +1.6 pp |
| 7 | 26.2% | 26.2% | +0.0 pp |
| 8 | 24.5% | 24.5% | +0.0 pp |
| 9 | 22.8% | 22.8% | +0.0 pp |
| 10 | 23.0% | 23.0% | +0.0 pp |
| A | 16.7% | 20.1% | +3.4 pp |
A higher bust rate does not make H17 a better rule for the player overall: the dealer also turns some soft 17s into stronger hands. Compare the overall effect of the table rules, not bust probability alone.
Bust probability by up-card · H17
| Dealer shows | Chance the dealer busts (H17) |
|---|---|
| 2 | 35.7% |
| 3 | 37.7% |
| 4 | 39.7% |
| 5 | 41.8% |
| 6 | 43.9% |
| 7 | 26.2% |
| 8 | 24.5% |
| 9 | 22.8% |
| 10 | 23.0% |
| A | 20.1% |
The full picture: every dealer outcome
Bust chance is half the story — it also matters what hand the dealer makes when they don't bust. A 7 mostly makes a mediocre 17; a 10 usually makes a 20. This is the complete distribution:
| Dealer shows | 17 | 18 | 19 | 20 | 21 | Bust |
|---|---|---|---|---|---|---|
| 2 | 13.0% | 13.7% | 13.1% | 12.6% | 12.0% | 35.7% |
| 3 | 12.6% | 13.2% | 12.7% | 12.2% | 11.6% | 37.7% |
| 4 | 12.2% | 12.7% | 12.3% | 11.8% | 11.3% | 39.7% |
| 5 | 11.8% | 12.3% | 11.8% | 11.4% | 10.9% | 41.8% |
| 6 | 11.5% | 11.5% | 11.5% | 11.0% | 10.6% | 43.9% |
| 7 | 36.9% | 13.8% | 7.9% | 7.9% | 7.4% | 26.2% |
| 8 | 12.9% | 35.9% | 12.9% | 6.9% | 6.9% | 24.5% |
| 9 | 12.0% | 12.0% | 35.1% | 12.0% | 6.1% | 22.8% |
| 10 | 12.1% | 12.1% | 12.1% | 37.1% | 3.7% | 23.0% |
| A | 8.3% | 20.7% | 20.7% | 20.7% | 9.6% | 20.1% |
Values are rounded, so rows may not total exactly 100%. Ten and ace rows are conditioned on the dealer not having blackjack under the US peek rule. Six-deck shoe (deck count moves these figures only slightly); deterministic fixed-proportion model, not Monte Carlo simulation. Read the assumptions or download the CSV.
Why do dealer-ace probabilities differ between websites?
The question changes after the dealer checks for blackjack. Our ten and ace rows describe hands where blackjack has already been ruled out. Before the check, some hands end immediately in a dealer blackjack, so the unconditional bust rate is lower. A dealer blackjack and a three-or-more-card 21 are different outcomes.
Our displayed ace bust rate of 20.1% is the H17 after-check estimate, not the chance of a bust whenever an ace is first exposed. The S17 estimate is 16.7%. Wizard of Odds explains the same before/after-check distinction. Its finite-deck tables can differ slightly from our fixed-proportion model; match both the rules and the model before comparing decimals.
How to actually use these numbers
- Stand on stiffs (12–16) against 2–6. Your hand is weak, but the dealer busts 36–44% of the time. Don't risk busting first — let them take the risk. (Exception: hit 12 vs 2 and 3 — their bust rates are the lowest of the weak cards.)
- Hit stiffs against 7–A. The dealer makes 17+ about three times in four. Standing on your 14 just waits to lose; you have to improve. The full logic is on the strategy chart.
- Double hard into the bust cards. Against 4, 5, 6, the combination of "you're favored to make a hand" and "they're likely to bust" is when betting more is most profitable — doubling 11 vs 6 averages +67¢ per $1.
- Respect the 7. It busts more than 8, 9, or 10 — but when it survives, it usually makes a weak 17 (37% of the time). That's why 17 pushes so often against a 7, and why you stand on 17 but keep hitting soft 17 yourself.
- The ace is the monster. Lowest bust rate in this H17 table, with many outcomes at 18–20. Insurance is a separate decision about dealer blackjack before the check; these conditioned rows cannot price it. Read the insurance explanation.
Frequently asked questions
What are the bust cards in blackjack?
The "bust cards" are the dealer up-cards most likely to make the dealer go over 21: the 4, 5, and 6, which bust about 39.7%, 41.8%, and 43.9% of the time respectively (6-deck H17). When the dealer shows one of these, basic strategy has you stand on stiff hands and let them take the bust risk.
What are the odds of the dealer busting with a 6 (or a 5)?
A dealer showing a 6 busts 43.9% of the time and a 5 busts 41.8% (6-deck, dealer hits soft 17) — the two highest bust rates of any up-card. See the table above for every up-card.
Which up-card busts the most?
The 6 — 43.9% in an H17 game (42.3% S17). The 5 and 4 follow at 41.8% and 39.7%. These three are the "bust cards" basic strategy attacks.
How often does the dealer bust overall?
Roughly 28% of hands across all up-cards in a 6-deck game. The strategic value is in the spread: ~44% vs a 6 down to ~20% vs an ace.
Why does the dealer always seem to pull a 20 with a ten up?
A ten up makes exactly 20 about 37% of the time and reaches 17+ a total of 77% of the time. It's not luck — it's the most ten-rich deck composition in the game. That's why you must hit your stiffs against it. And it isn't the game being rigged: the dealer's whole advantage is acting last under these fixed rules.
Are these numbers simulated or exact?
They are calculated deterministically rather than sampled by simulation, but “exact” would overstate the implementation: future draws use fixed shoe proportions. The methodology documents that approximation.